In the previous stand-up we discussed setting a baseline around product metrics. This baseline simply maps out the current metrics that are gathered by the team, and begins to understand whether they are useful (not a vanity metric) and whether they are leading or lagging indicators.
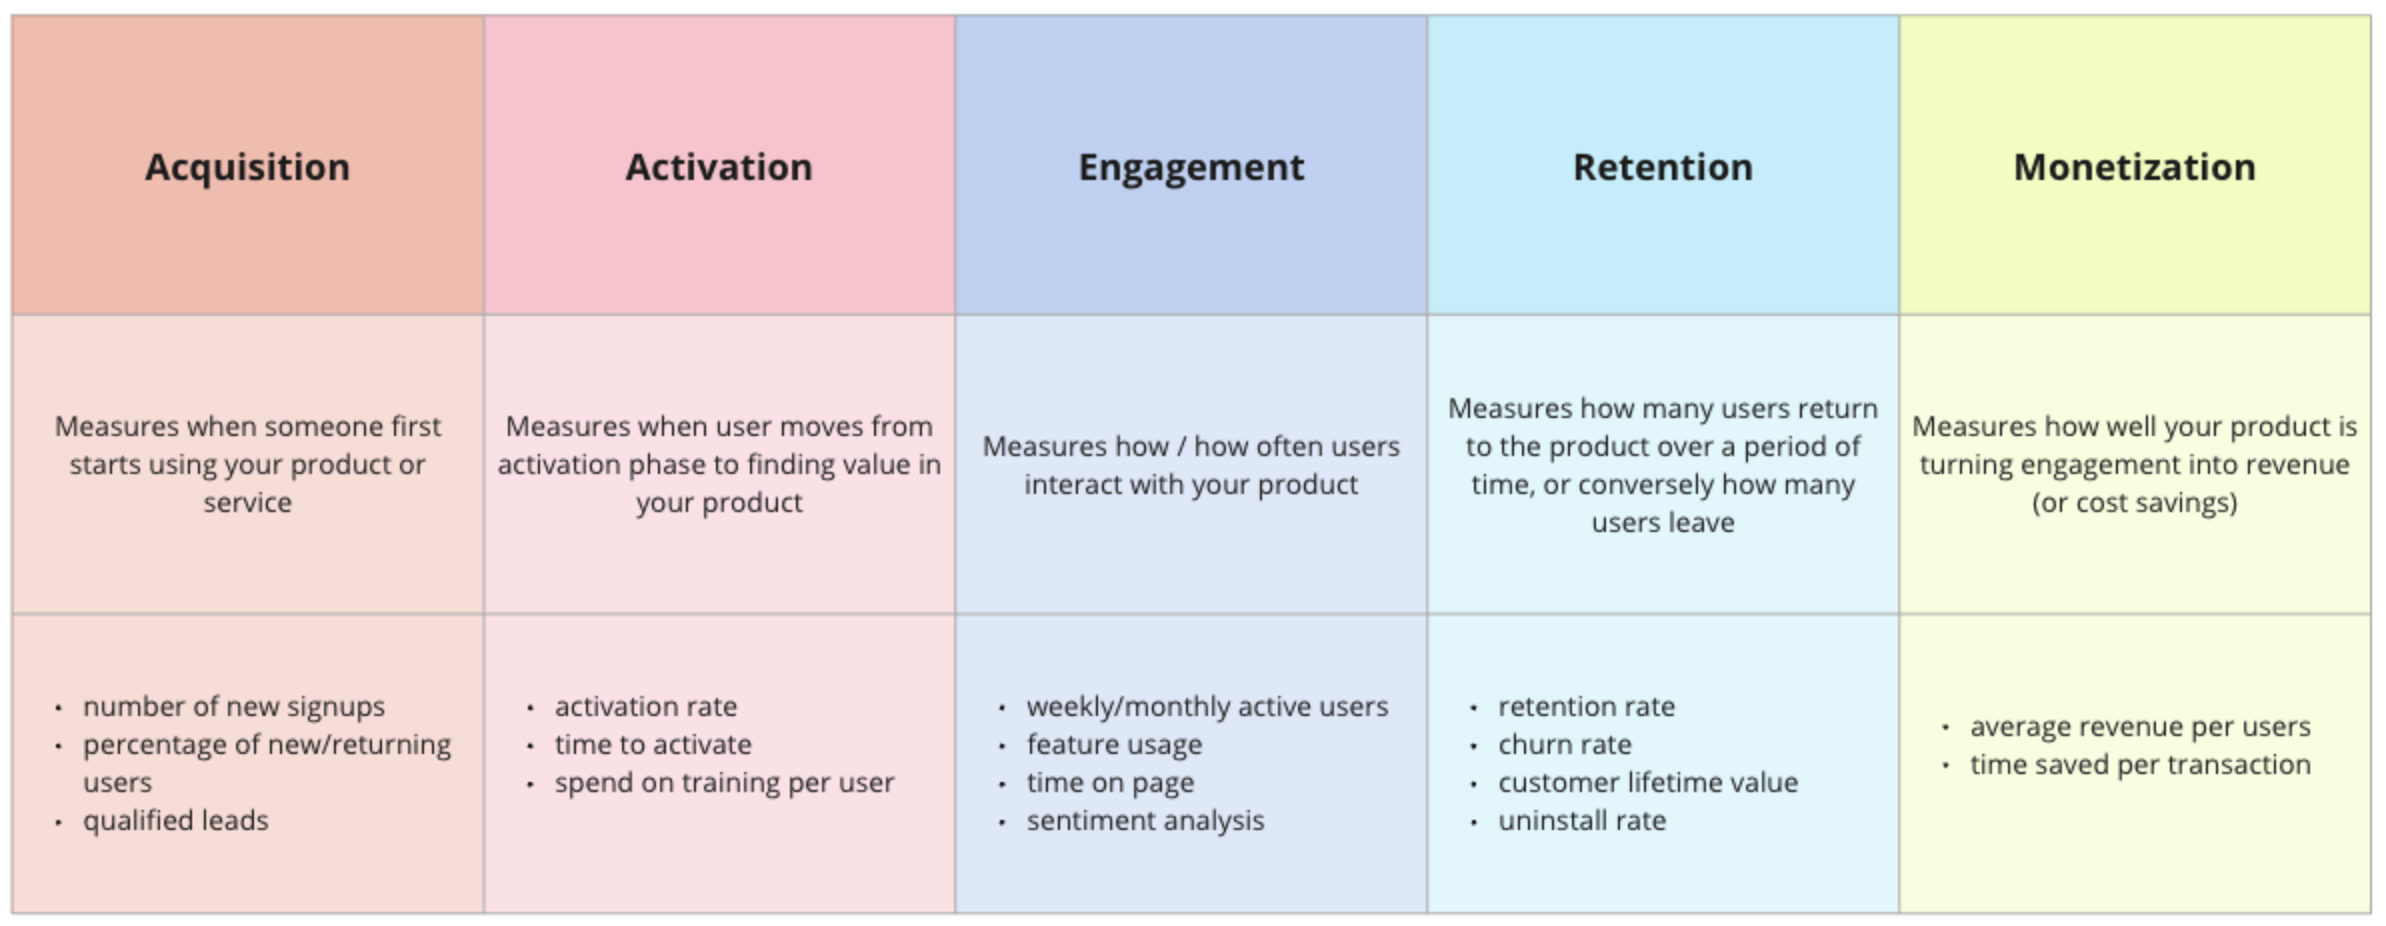
After a current baseline has been found, metrics can be mapped to stages of the user’s journey. While not every product is one that results in a sale, the below chart can be used to understand what types of metrics can exist at each stage.
These example metrics are not exhaustive, and many more can be tailored to a specific product. Ideally, each product team can report on metrics from each of the user journey phases.
North Star Metrics
Many product teams subscribe to the idea of a North Star Metric. This metric is a single measurement that best captures the core value your product delivers to the user. The focus of a North Star is on retainable long-term user growth and satisfaction. This metric would be in your elevator-pitch about the success of your product.
Many successful product companies use a North Star Metric to keep their teams focused on their core value. For example:
Google - clicking a search result
AirBnB - nights booked
Facebook - daily active users
WhatsApp - number of messages a user sends
Salesforce - average records created per account
Slack - number of paid teams
How to figure out your North Star Metric
something that indicates your user experienced the core value of your product (define your user's success moment)
reflects the user's engagement and activity level
something you have control over / can affect
easily understood and communicated
can be tied to product success / company success (aligned to your vision)
North Star metrics should not be swapped out frequently. They should meet the criteria above and then be given long enough to prove useful to measuring long term success.
STAND-UP EXERCISE
Ask your product team to map their baseline metrics to the user journey using the chart above. Is there one metric that stands out as the single best indicator of long-term value of your product? Can one of these metrics be your North Star Metric - both aligned to your vision and tied to company/product success?
Develop your North Star Metric and begin to watch it as a team. Is it something you have control over as you experiment and ship? If so, begin reporting on it to your stakeholders as your North Star, and holding yourself accountable to its outcome.

