Measuring Execution: Product Metrics, Part 2

by Kristen DeLap


In the previous stand-up we discussed setting a baseline around product metrics. This baseline simply maps out the current metrics that are gathered by the team, and begins to understand whether they are useful (not a vanity metric) and whether they are leading or lagging indicators.

After a current baseline has been found, metrics can be mapped to stages of the user’s journey. While not every product is one that results in a sale, the below chart can be used to understand what types of metrics can exist at each stage.

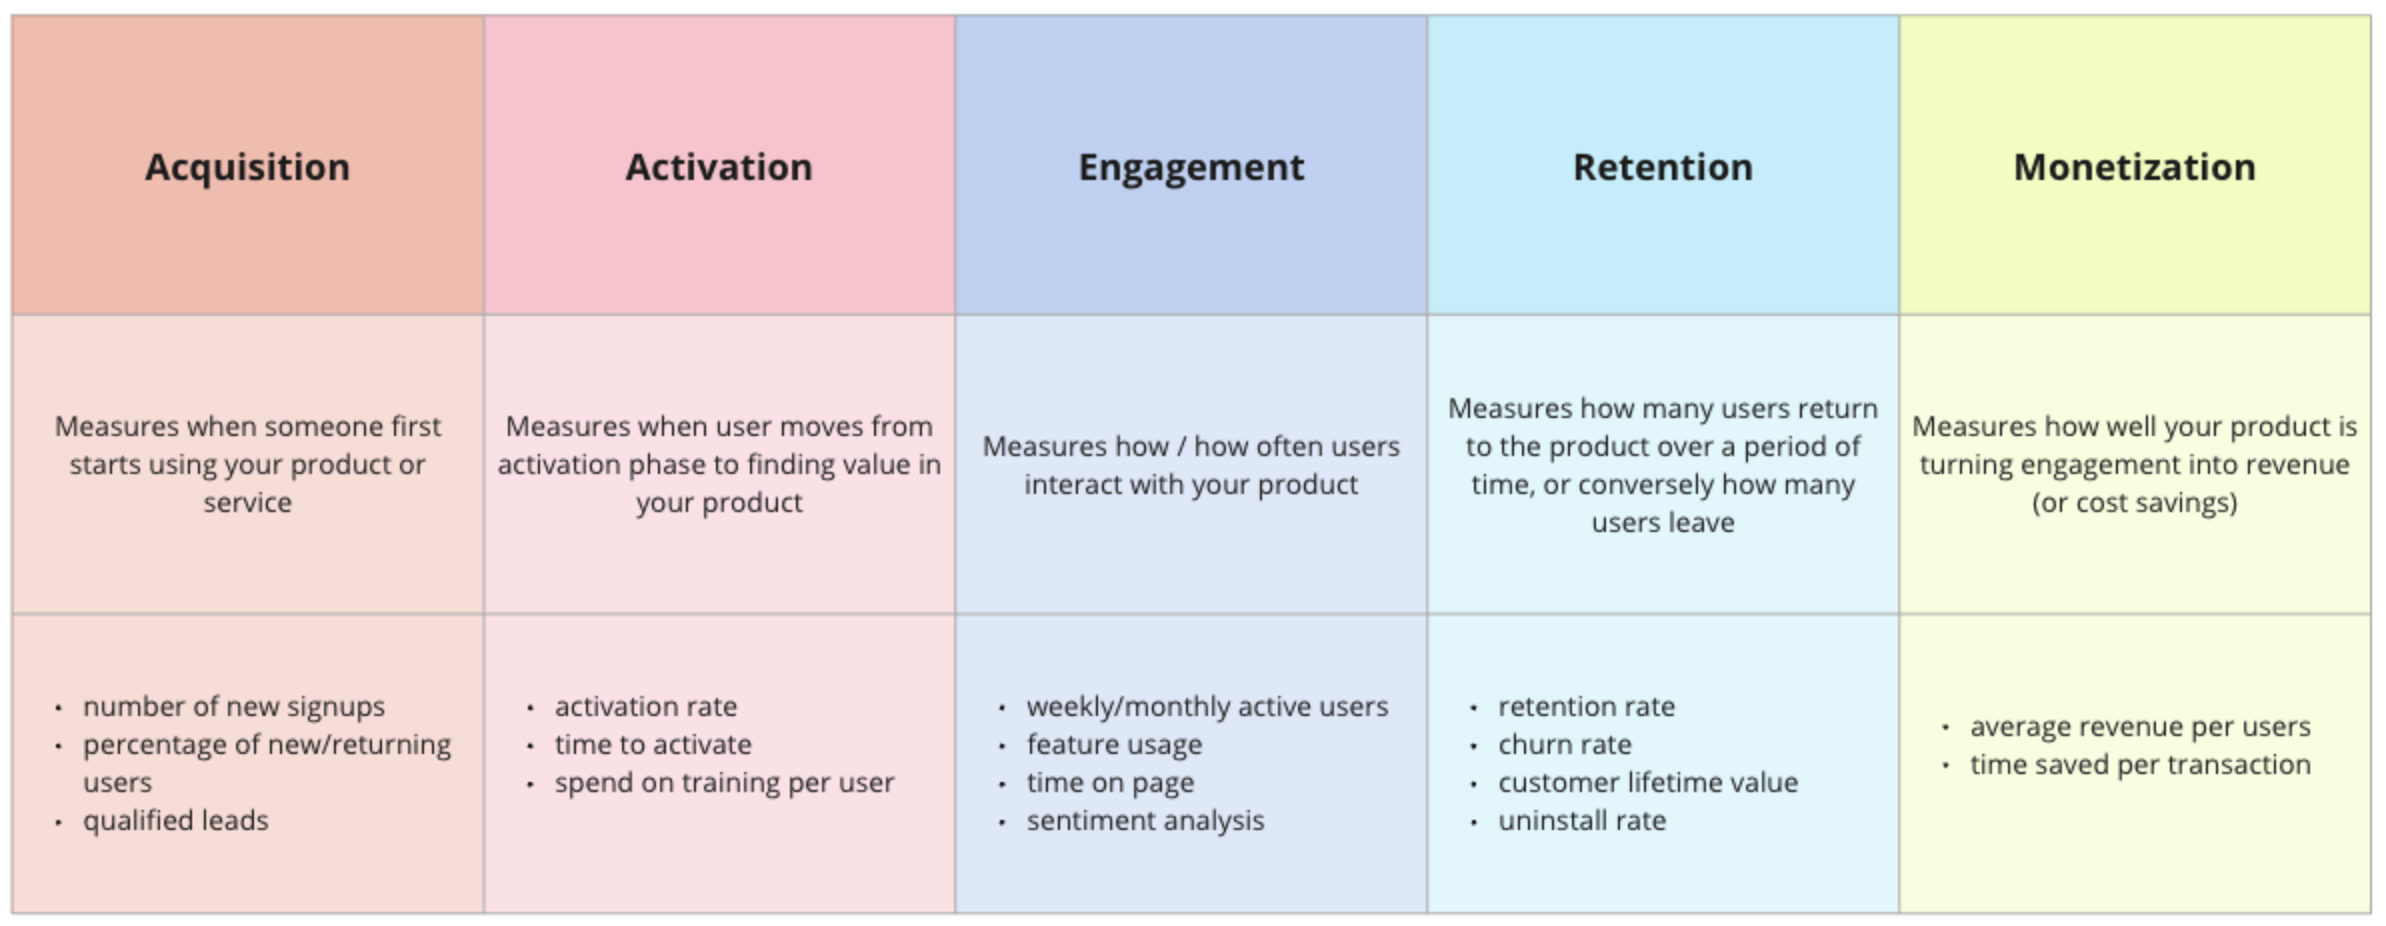
These example metrics are not exhaustive, and many more can be tailored to a specific product. Ideally, each product team can report on metrics from each of the user journey phases.

North Star Metrics
Many product teams subscribe to the idea of a North Star Metric. This metric is a single measurement that best captures the core value your product delivers to the user. The focus of a North Star is on retainable long-term user growth and satisfaction. This metric would be in your elevator-pitch about the success of your product.

Many successful product companies use a North Star Metric to keep their teams focused on their core value. For example:

  • Google - clicking a search result

  • AirBnB - nights booked

  • Facebook - daily active users

  • WhatsApp - number of messages a user sends

  • Salesforce - average records created per account

  • Slack - number of paid teams

How to figure out your North Star Metric

  • something that indicates your user experienced the core value of your product (define your user's success moment)

  • reflects the user's engagement and activity level

  • something you have control over / can affect

  • easily understood and communicated

  • can be tied to product success / company success (aligned to your vision)

North Star metrics should not be swapped out frequently. They should meet the criteria above and then be given long enough to prove useful to measuring long term success.


STAND-UP EXERCISE

Ask your product team to map their baseline metrics to the user journey using the chart above. Is there one metric that stands out as the single best indicator of long-term value of your product? Can one of these metrics be your North Star Metric - both aligned to your vision and tied to company/product success?

Develop your North Star Metric and begin to watch it as a team. Is it something you have control over as you experiment and ship? If so, begin reporting on it to your stakeholders as your North Star, and holding yourself accountable to its outcome.


Measuring Execution: Product Metrics, Part 1

by Kristen DeLap


To consistently drive scalable and sustainable growth for your product, you are likely going to need to understand a set of useful metrics around your product or platform. At their core, product metrics are indicators that show how users interact with a product. But there are several types of metrics, and varying levels of utility.

There are two primary groups to metrics, leading and lagging indicators.

Leading indicators - tells you where your business is headed

  • drive daily tactics

  • measure frequently (and easily)

Lagging indicators - tells you if your actions were successful

  • drives long-term strategy

  • measure at a longer time interval (quarterly / annually)

Neither of these is “better”, they are simply used for different purposes on a different cadence. Your product team should be tracking metrics in both categories.

There are some metrics that are bad, however. These fall into two categories - vanity metrics, and metrics without context.

Vanity Metrics

  • look good but don't measure meaningful results

  • aren't actionable or controllable in a repeated way

  • page views / "likes" / number of email subscribers

Metrics without context

  • Often, running totals

  • For example, "10,000 registered users" sounds good, but not if there are only "100 active monthly users"

To understand if you are working with vanity metrics, use this helpful worksheet from Amplitude.

Understanding the categories of metrics can help set a standard on gathering information about your product’s performance. Use the stand-up exercise below to help set that baseline.


STAND-UP EXERCISE

After reviewing definitions of leading / lagging indicators and understanding what types of metrics are bad, make a list of measurements the product team is currently using. Which category do these fall into? Are any of them vanity metrics or lacking necessary context to define success? Which of these measurements is used only internally to the team and which are shared out to stakeholders? How often have these measurements been used to inform a decision on the product?

Once a baseline is in place, the team can dive into making sure metrics correspond to each part of the user journey, as well as determining a primary North Star metric. More of that to come in part two.

Image by Freepik


Product Stability Risk

by Kristen DeLap


Vision is by nature a long-term perspective - peering off into the future at an undefined point. A product vision, therefore, drives strategy, priorities, and execution through agreement on long term outcomes. But as product teams, we cannot solely focus on the long term. We must align on the short-term risks that threaten the long-term outcomes and stability, so we all understand how to navigate the product's survival.

In Radical Product Thinking, Dutt defines five categories of risk to a product. They are outlined below with some examples I’ve pulled from my experience.

Technology / Operational Risk
- Needed tech solutions are not available / feasible
- Operational issues (such as, scalability)
- Cybersecurity issues

Legal / Regulatory Risk
- Not meeting necessary compliance standards
- Risk of being sued / receiving demand letters

Financial Risk
- Running out of budget before launch/completion
- Not generating enough revenue
- On-going budget not enough to maintain product

Personnel Risk
- Product cannot survive departure of key personnel
- Resources being pulled into other projects / products

Stakeholder Risk
- Powerful stakeholders are skeptical of product / outcomes
- Potential to lose executive sponsorship

Identifying the immediate risks to your product is necessary for any team. This allows not only for mitigation of the risk, but an additional framework for prioritizing product activities. Then each activity can be placed on the below quadrant, which measures alignment to vision and stability.


STAND-UP EXERCISE
Ask your team to think through what they think might be the biggest stability risk to the product at this moment? What category does it fall in? Are you all aligned? You might also think about risks in terms of time scale - what do you project the biggest risk to be in the next 3 months? Next year?
Once the stability risks are identified, ask what the consequences might be if the risk was realized. Then you can begin brainstorming a mitigation plan.


Inspiration via your 5 senses

by Kristen DeLap


Inspiration can come from a myriad of places, but often we don’t take the time to cultivate it. The author Gretchen Rubin encourages us to understand more about our five senses, and which ones we might be neglecting, as a key to unlocking more inspiration in our lives. She says, “When I started work on my book Life in Five Senses, I hoped that by tuning in to my five senses, I’d find a new source of energy, love, luck, mindfulness—and creativity. But I was unprepared for just how sparked my creativity would get! I found that when I paid greater attention to seeing, hearing, smelling, tasting, and touching, I ignited my imagination and my desire to create.”

By making intentional direct contact with the world through our range of senses, we can find more inspiration. Sometimes to the key to the mind is through the body. In an extreme case, some folks experience synesthesia, where stimulating one sense can trigger a seemingly-unrelated sense. For example, a sound creates a specific a color. An article simply titled Sensory Inspiration in Avant Arte explains how some artists throughout history have had almost superhuman sensory inputs and responses.

But you don’t have to be super human or call yourself an artist to solicit more inspiration from your five senses. Gretchen Rubin makes the case that just determining your most neglected sense and leaning into it can unlock inspiration. She’s created a 5 Senses Quiz to help folks identify their most neglected sense, and then provides novel ways to engage it. For example, if your neglected sense is smell, maybe find a flower shop to literally stop and smell the roses, or if it is hearing, change up the tone of your phone alarm.

Enhanced inspiration and creativity is not just for those in the design field. Creativity helps with problem solving, cultivating a growth mindset, and empathy - all traits any product team can benefit from.


STAND-UP EXERCISE

Ask your team to take Gretchen Rubin’s 5 Senses Quiz. Compare results. Were you surprised by which sense was most neglected? Do you agree with the results? What are some ways you can “awaken” this sense more in your day-to-day?

Then just share sources of inspiration with each other. Where do you typically turn when you need a boost? A specific site / substack / podcast? A place like a museum or library or park? A person? An activity? Is that with people or on your own? Create a mini-catalog of inspiration for each other.


Identifying Stakeholders

by Kristen DeLap


A key part of product management is managing stakeholders, as most teams require participation, guidance, and approval from a wide range of people across the organization. But oftentimes, product managers treat all stakeholders equally in terms of focus or time expended. A key component to effective stakeholder management is identifying your various stakeholders and grouping them by need. Having this knowledge will help your product team communicate effectively with these groups, and therefore gain early alignment on goals and plans, as well as address any conflict or risk early on.

Often stakeholders can be grouped by their levels of power and interest. A simple two by two can map these out - resulting in four groups: Players, Context Setters, Subjects, and Crowd. (This matrix was popularized by the book Making Strategy: Mapping out Strategic Success.)

The needs of each of these groups are different.

Players
High Interest, High Power
- need to be managed closely
- need high-quality data/insights regularly
- get buy-in on big decisions early
- ask for feedback often

Context Setters
High Power, Low Interest
- need to be kept satisfied
- they can influence the future overall context
- raise awareness with them
- could convert them to players?

Subjects
High Interest, Low Power
- need to be kept informed, "read only" stakeholders
- make use of their interest through low-risk areas of involvement
- "goodwill ambassadors"

Crowd
Low Interest, Low Power
- not worth time to actively manage
- inform via general communications
- aim to move into Subjects

How you interact with these groups in form of the cadence, information provided, and size of audience will all vary. But it is important to keep these general needs in mind, as the more you can tailor communication to gain support or approval from various stakeholders, the more likely your initiatives are to succeed.


STAND-UP EXERCISE

Have your team do a stakeholder analysis by first listing all the groups (or individuals) they know to be stakeholders for your product. Then work to sort these folks into the 2x2 matrix, paying attention to both the level of power and interest. After their needs are identified, the product manager and team can begin to create tailored communication plans, focusing on building and maintaining trust with each of the groups.