Product Team Roles

by Kristen DeLap


Books are written, podcasts are produced, TedTalks are given, all about product and product teams. So much so that it can seem like there is only one correct way to build a product team. However, a more encompassing approach might be to take an Agile mindset to building a product team. At its root, a product team is a cross functional team (a team with members from different functional areas) who are united to design, develop, and ship a product that fulfills the target user's needs.

How that team is comprised can vary. The core components of responsibility can be met by specialists or generalists. You can have just a couple folks on the team or enough to eat two pizzas. Your organization may have both a product and a project structure, which introduces a new set of players.

Regardless of who is on the team, responsibilities should be defined. Everyone on the product team should know their role. This chart is generally what we shoot for within the teams I manage - from a product perspective. This chart does not include engineering roles. In a different organization, you might also want to add a product marketing role, or more.

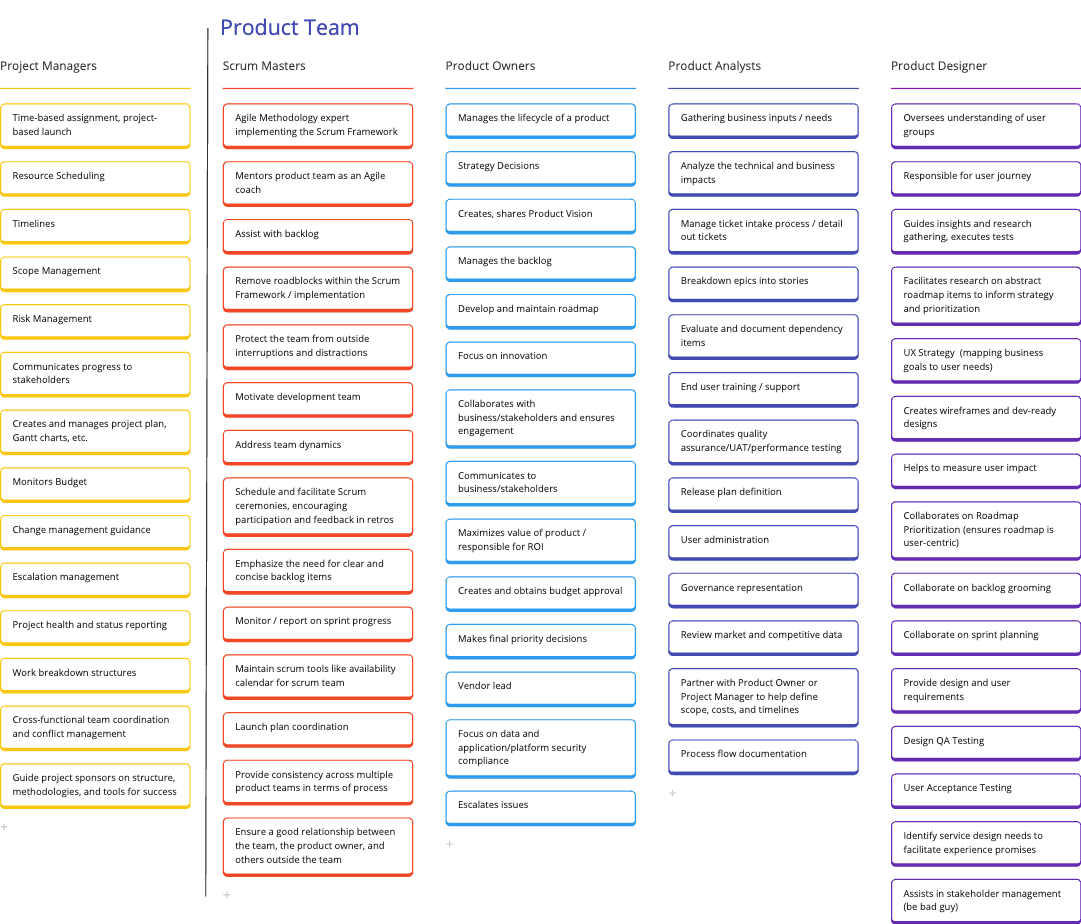
Note that the headers of these columns denote a role on the team, not necessarily a job title. The team just needs to agree on who is performing what role.

The idea is that with agreement on who does what within the team, there is more empowerment for that person to take responsibility for the items within their jurisdiction. There is more individual autonomy and accountability, which leads to better team autonomy and accountability. The visibility into each other’s roles also allows for more communication within the team.

Teams evolve over time. New roles are needed as the team matures; folks leave and don’t get replaced; the product changes and requires a different setup. Periodically, the team should evaluate what is working and what might be missing. Iterating on the team construction is also part of the Agile process.

If you are a director or portfolio manager, you may also need to consider how you structure your product teams within the larger organization. There are just as many options here, which we can perhaps cover in the future.


STAND-UP EXERCISE

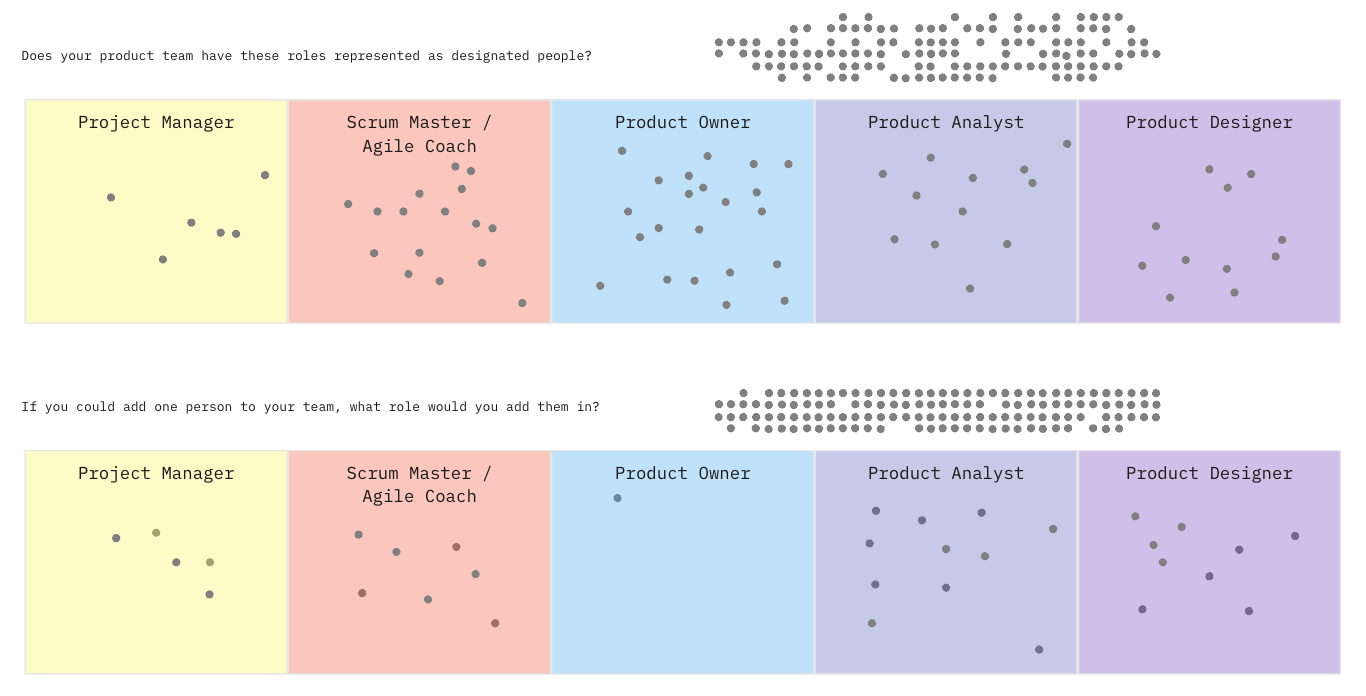
A product team should all agree on roles and responsibilities. If you do not have a responsibilities chart like the one above for your team, you should construct it. An Agile coach or a manager can help bring an unbiased eye if there are any questions or discrepancies in jurisdiction.

One you know who is doing what, a good discussion can be “who are we missing”? If another person could be added to the team, which role would be most beneficial to add them into? Portfolio managers, this is a great exercise to see if your organization is under-emphasizing certain areas of product management.


Supporting Users with Micro Interactions

by Kristen DeLap


Any product should not only provide utility or interest for users, but also support them in their interactions. One way to do that is through the use of micro-interactions - small indicators or animations used to communicate meaningful feedback to the user. This supports the user in a more intuitive, engaging, and efficient experience with the product.

Also, it is just a human tendency to expect something to happen when you click a button, scroll a page, add an item to the cart, swipe left on a card, etc.

To be defined as a micro interaction, it should be triggered by the user or the system AND give feedback on an action. A simple gif or animation is not a micro interaction because it is not triggered by the user. A button by itself is not a micro interaction, unless it provides feedback when the user clicks/taps. A video player is a feature, but the volume control slider within it would be a micro interaction.

For more examples of micro interactions, and a brief explainer on Dan Saffer’s triggers and rules, check out this article by UserPilot.


STAND-UP EXERCISE

After learning about micro interactions, ask your team to come up with examples from the products they use (or competitor’s products, potentially). Are these delightful? Do they make the product more intuitive or efficient? Are any of them exceptionally on-brand (or maybe off-brand)?

Then think about your own product. Are there areas where a user could feel more supported in their interactions with the interface or process? Is there information that could be better or more holistically communicated? Is there an area where you can reinforce the natural desire for feedback?


Measuring Execution: Product Metrics, Part 2

by Kristen DeLap


In the previous stand-up we discussed setting a baseline around product metrics. This baseline simply maps out the current metrics that are gathered by the team, and begins to understand whether they are useful (not a vanity metric) and whether they are leading or lagging indicators.

After a current baseline has been found, metrics can be mapped to stages of the user’s journey. While not every product is one that results in a sale, the below chart can be used to understand what types of metrics can exist at each stage.

These example metrics are not exhaustive, and many more can be tailored to a specific product. Ideally, each product team can report on metrics from each of the user journey phases.

North Star Metrics
Many product teams subscribe to the idea of a North Star Metric. This metric is a single measurement that best captures the core value your product delivers to the user. The focus of a North Star is on retainable long-term user growth and satisfaction. This metric would be in your elevator-pitch about the success of your product.

Many successful product companies use a North Star Metric to keep their teams focused on their core value. For example:

  • Google - clicking a search result

  • AirBnB - nights booked

  • Facebook - daily active users

  • WhatsApp - number of messages a user sends

  • Salesforce - average records created per account

  • Slack - number of paid teams

How to figure out your North Star Metric

  • something that indicates your user experienced the core value of your product (define your user's success moment)

  • reflects the user's engagement and activity level

  • something you have control over / can affect

  • easily understood and communicated

  • can be tied to product success / company success (aligned to your vision)

North Star metrics should not be swapped out frequently. They should meet the criteria above and then be given long enough to prove useful to measuring long term success.


STAND-UP EXERCISE

Ask your product team to map their baseline metrics to the user journey using the chart above. Is there one metric that stands out as the single best indicator of long-term value of your product? Can one of these metrics be your North Star Metric - both aligned to your vision and tied to company/product success?

Develop your North Star Metric and begin to watch it as a team. Is it something you have control over as you experiment and ship? If so, begin reporting on it to your stakeholders as your North Star, and holding yourself accountable to its outcome.


Measuring Execution: Product Metrics, Part 1

by Kristen DeLap


To consistently drive scalable and sustainable growth for your product, you are likely going to need to understand a set of useful metrics around your product or platform. At their core, product metrics are indicators that show how users interact with a product. But there are several types of metrics, and varying levels of utility.

There are two primary groups to metrics, leading and lagging indicators.

Leading indicators - tells you where your business is headed

  • drive daily tactics

  • measure frequently (and easily)

Lagging indicators - tells you if your actions were successful

  • drives long-term strategy

  • measure at a longer time interval (quarterly / annually)

Neither of these is “better”, they are simply used for different purposes on a different cadence. Your product team should be tracking metrics in both categories.

There are some metrics that are bad, however. These fall into two categories - vanity metrics, and metrics without context.

Vanity Metrics

  • look good but don't measure meaningful results

  • aren't actionable or controllable in a repeated way

  • page views / "likes" / number of email subscribers

Metrics without context

  • Often, running totals

  • For example, "10,000 registered users" sounds good, but not if there are only "100 active monthly users"

To understand if you are working with vanity metrics, use this helpful worksheet from Amplitude.

Understanding the categories of metrics can help set a standard on gathering information about your product’s performance. Use the stand-up exercise below to help set that baseline.


STAND-UP EXERCISE

After reviewing definitions of leading / lagging indicators and understanding what types of metrics are bad, make a list of measurements the product team is currently using. Which category do these fall into? Are any of them vanity metrics or lacking necessary context to define success? Which of these measurements is used only internally to the team and which are shared out to stakeholders? How often have these measurements been used to inform a decision on the product?

Once a baseline is in place, the team can dive into making sure metrics correspond to each part of the user journey, as well as determining a primary North Star metric. More of that to come in part two.

Image by Freepik


Product Stability Risk

by Kristen DeLap


Vision is by nature a long-term perspective - peering off into the future at an undefined point. A product vision, therefore, drives strategy, priorities, and execution through agreement on long term outcomes. But as product teams, we cannot solely focus on the long term. We must align on the short-term risks that threaten the long-term outcomes and stability, so we all understand how to navigate the product's survival.

In Radical Product Thinking, Dutt defines five categories of risk to a product. They are outlined below with some examples I’ve pulled from my experience.

Technology / Operational Risk
- Needed tech solutions are not available / feasible
- Operational issues (such as, scalability)
- Cybersecurity issues

Legal / Regulatory Risk
- Not meeting necessary compliance standards
- Risk of being sued / receiving demand letters

Financial Risk
- Running out of budget before launch/completion
- Not generating enough revenue
- On-going budget not enough to maintain product

Personnel Risk
- Product cannot survive departure of key personnel
- Resources being pulled into other projects / products

Stakeholder Risk
- Powerful stakeholders are skeptical of product / outcomes
- Potential to lose executive sponsorship

Identifying the immediate risks to your product is necessary for any team. This allows not only for mitigation of the risk, but an additional framework for prioritizing product activities. Then each activity can be placed on the below quadrant, which measures alignment to vision and stability.


STAND-UP EXERCISE
Ask your team to think through what they think might be the biggest stability risk to the product at this moment? What category does it fall in? Are you all aligned? You might also think about risks in terms of time scale - what do you project the biggest risk to be in the next 3 months? Next year?
Once the stability risks are identified, ask what the consequences might be if the risk was realized. Then you can begin brainstorming a mitigation plan.