Technical Debt

by Kristen DeLap


It is a rare a product that does not carry some technical debt. Trade-offs and compromises are made - to meet deadlines or work within other constraints. Some of those decisions have consequences that do not age well over time, and that is technical debt - the implied cost of additional work caused by choosing an easy or limited solution (instead of the more desired approach that would take longer / cost more / use additional resources.) It is similar to financial debt - you take it on because the value of having the item now is more important than saving up to purchase it when you can afford it. Eventually the debt must be paid down, and similar to financial debt, sometimes that comes with interest owed.

Not all technical debt is bad. Product teams must balance the business goals and outcomes with technical solutioning and implementation decisions. The key is to take on the debt responsibly. Part of doing that is identifying when you are making a decision that is not ideal. Thinking through - or at least acknowledging - a future fix at the time it is implemented can be valuable.

Additionally, categorizing your debt can be a helpful exercise, to better understand the trade-offs on your product and to help in the debt remediation phases.

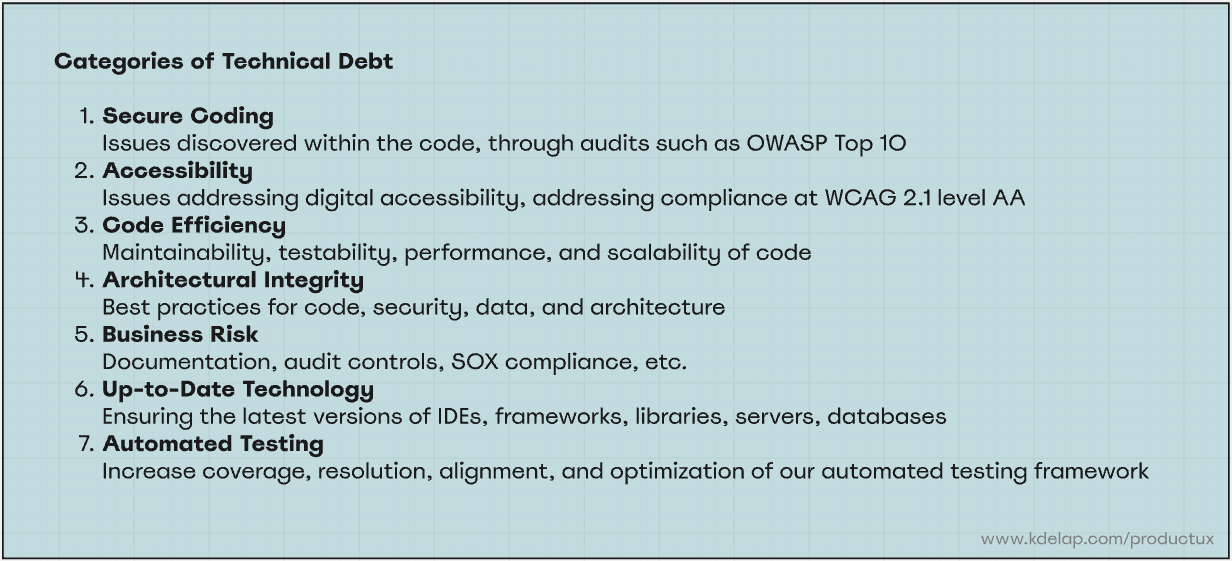
Some categories of technical debt are:

Secure Coding - issues or vulnerabilities discovered within the code, through audits such as OWASP Top 10
Accessibility - issues addressing digital accessibility, at a minimum meeting compliance with WCAG 2.1 level AA or AAA
Code Efficiency - Maintainability, testability, performance, and scalability of code
Architectural Integrity - Best practices for code, security, data, and architecture
Business Risk - Documentation, audit controls, SOX compliance, etc.
Up-to-Date Technology - Ensuring the latest versions of IDEs, frameworks, libraries, servers, databases
Automated Testing - Increase coverage, resolution, alignment, and optimization of automated testing framework

The best approaches to technical debt focus on thoughtful decisions about when to take on the debt, and careful tracking and planned remediation.


STAND-UP EXERCISE

As a product team, identify the categories of technical debt that your product does/could encounter. Is there a way to track these categories on your tickets / incidents? Discuss how the team could systematically remediate technical debt. Is it best to focus a percentage of every sprint’s points toward one or more of these categories? Is it better to use one or two sprints a quarter to completely dedicate toward eliminating debt? Is there a way to coordinate with other teams, if you have reliance or dependencies with them? Create a plan for your team, and revisit it - as well as your tracked metrics - on a regular basis as your team and product evolves.

Blue box with bullet points of seven categories of technical debt listed

Measuring Execution: Product Metrics, Part 2

by Kristen DeLap


In the previous stand-up we discussed setting a baseline around product metrics. This baseline simply maps out the current metrics that are gathered by the team, and begins to understand whether they are useful (not a vanity metric) and whether they are leading or lagging indicators.

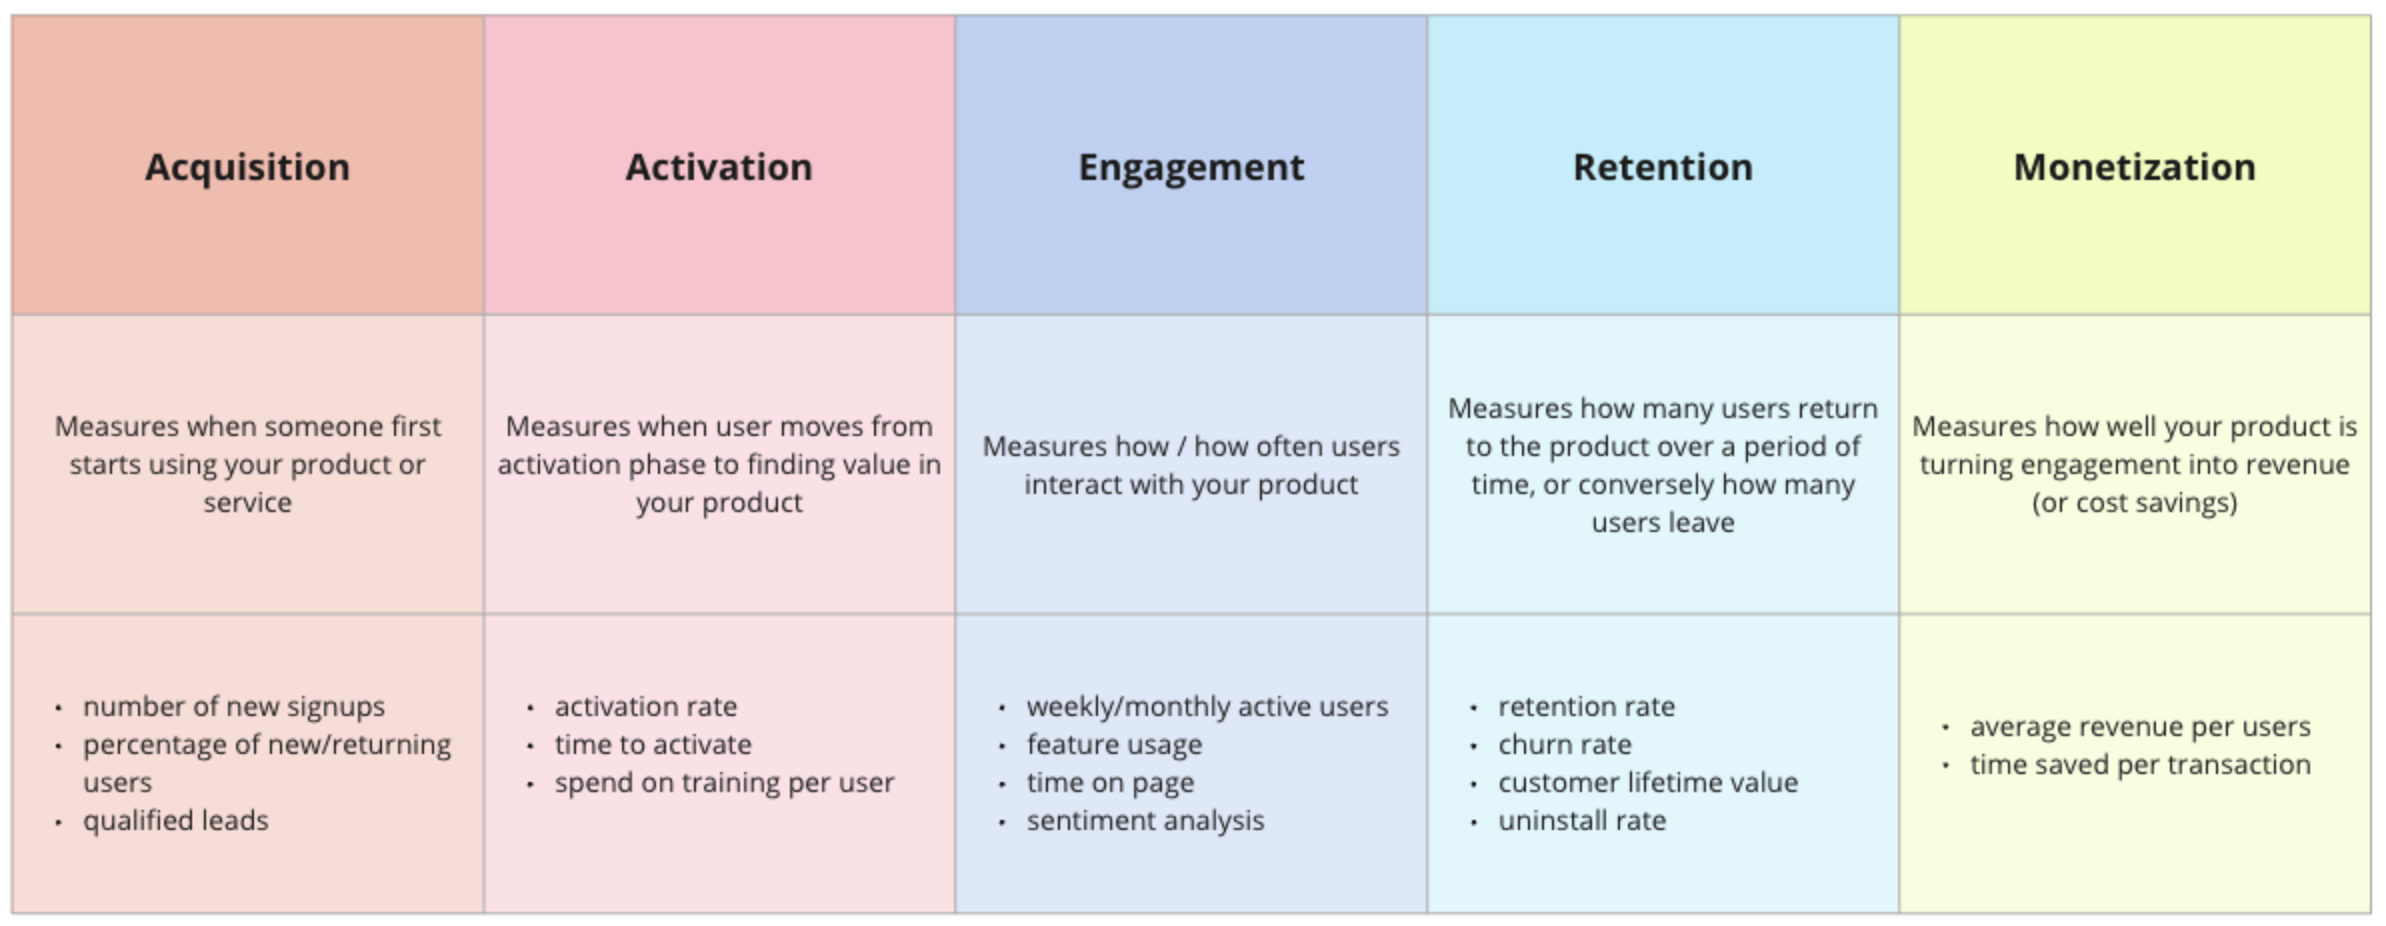
After a current baseline has been found, metrics can be mapped to stages of the user’s journey. While not every product is one that results in a sale, the below chart can be used to understand what types of metrics can exist at each stage.

These example metrics are not exhaustive, and many more can be tailored to a specific product. Ideally, each product team can report on metrics from each of the user journey phases.

North Star Metrics
Many product teams subscribe to the idea of a North Star Metric. This metric is a single measurement that best captures the core value your product delivers to the user. The focus of a North Star is on retainable long-term user growth and satisfaction. This metric would be in your elevator-pitch about the success of your product.

Many successful product companies use a North Star Metric to keep their teams focused on their core value. For example:

  • Google - clicking a search result

  • AirBnB - nights booked

  • Facebook - daily active users

  • WhatsApp - number of messages a user sends

  • Salesforce - average records created per account

  • Slack - number of paid teams

How to figure out your North Star Metric

  • something that indicates your user experienced the core value of your product (define your user's success moment)

  • reflects the user's engagement and activity level

  • something you have control over / can affect

  • easily understood and communicated

  • can be tied to product success / company success (aligned to your vision)

North Star metrics should not be swapped out frequently. They should meet the criteria above and then be given long enough to prove useful to measuring long term success.


STAND-UP EXERCISE

Ask your product team to map their baseline metrics to the user journey using the chart above. Is there one metric that stands out as the single best indicator of long-term value of your product? Can one of these metrics be your North Star Metric - both aligned to your vision and tied to company/product success?

Develop your North Star Metric and begin to watch it as a team. Is it something you have control over as you experiment and ship? If so, begin reporting on it to your stakeholders as your North Star, and holding yourself accountable to its outcome.


Measuring Execution: Product Metrics, Part 1

by Kristen DeLap


To consistently drive scalable and sustainable growth for your product, you are likely going to need to understand a set of useful metrics around your product or platform. At their core, product metrics are indicators that show how users interact with a product. But there are several types of metrics, and varying levels of utility.

There are two primary groups to metrics, leading and lagging indicators.

Leading indicators - tells you where your business is headed

  • drive daily tactics

  • measure frequently (and easily)

Lagging indicators - tells you if your actions were successful

  • drives long-term strategy

  • measure at a longer time interval (quarterly / annually)

Neither of these is “better”, they are simply used for different purposes on a different cadence. Your product team should be tracking metrics in both categories.

There are some metrics that are bad, however. These fall into two categories - vanity metrics, and metrics without context.

Vanity Metrics

  • look good but don't measure meaningful results

  • aren't actionable or controllable in a repeated way

  • page views / "likes" / number of email subscribers

Metrics without context

  • Often, running totals

  • For example, "10,000 registered users" sounds good, but not if there are only "100 active monthly users"

To understand if you are working with vanity metrics, use this helpful worksheet from Amplitude.

Understanding the categories of metrics can help set a standard on gathering information about your product’s performance. Use the stand-up exercise below to help set that baseline.


STAND-UP EXERCISE

After reviewing definitions of leading / lagging indicators and understanding what types of metrics are bad, make a list of measurements the product team is currently using. Which category do these fall into? Are any of them vanity metrics or lacking necessary context to define success? Which of these measurements is used only internally to the team and which are shared out to stakeholders? How often have these measurements been used to inform a decision on the product?

Once a baseline is in place, the team can dive into making sure metrics correspond to each part of the user journey, as well as determining a primary North Star metric. More of that to come in part two.

Image by Freepik